
Major Release | 2024 County/District Low-Altitude Economy Industrial Development Index Report
2025/05/07


Aircraft Owners and Pilots Association of China (China AOPA)
Zhuhai AOPA Private Equity Fund Management Co., Ltd. (AOPA Capital)
Suzhou Planning & Design Research Institute Co., Ltd.
Major Release
I. Research Background
Against the backdrop of an accelerating reshaping of the global economy and a new round of scientific and industrial transformation, the low-altitude economy—as a strategic emerging industry—is becoming an important force for growth and industrial upgrading. Centered on flight activities in airspace below 3,000 meters, it deeply integrates aviation, communications, AI and other frontier technologies. Through drones, electric vertical take-off and landing aircraft (eVTOL) and other platforms, it is driving profound change across transport, logistics, inspection, agricultural plant protection, emergency response and more, forming a comprehensive economic form with strong growth potential.
On the policy side, since the CPC Central Committee and the State Council issued the Outline of the National Comprehensive Three-dimensional Transportation Network Plan in 2021—first explicitly calling for development of the low-altitude economy—central and local governments have rolled out a series of policies and regulations that provide solid institutional support. The Interim Regulations on the Flight Management of Unmanned Aircraft and the draft Regulations of the People’s Republic of China on Airspace Management, both released in 2023, further standardized low-altitude flight order and encouraged rational use of low-altitude resources, stimulating market participation. In December 2023, the Central Economic Work Conference called for building several strategic emerging industries including biomanufacturing, commercial spaceflight and the low-altitude economy. During the 2024 National Two Sessions, “low-altitude economy” appeared for the first time in the Government Work Report and was listed among emerging and future industries for 2024, with a call to “actively build new growth engines such as the low-altitude economy.”
On the technology side, drones, eVTOL and other key technologies have made breakthrough progress in recent years: maturity has risen, costs have fallen, and application scenarios continue to expand. Rapid iteration has accelerated penetration across industries—especially last-mile logistics and urban congestion relief—and laid a solid foundation for the industrial ecosystem. With further innovation and integration, eVTOL is expected to become a core platform of the future low-altitude economy, leading new transformation in low-altitude mobility and logistics.
In market terms, the low-altitude economy is growing explosively. According to some authoritative estimates, China’s low-altitude economy is expected to reach RMB 670 billion in 2024, with strong momentum, and may climb to RMB 2 trillion by 2030. County- and district-level development is especially noteworthy: as basic units of the national economy, counties and districts—with distinctive resource endowments and industrial bases—have huge potential and have become an important force driving deeper development. Yet quantitative assessment and comparison of county/district low-altitude industrial development nationwide remain insufficient. This report aims to build a sound evaluation system, comprehensively and objectively assess the status quo, and provide useful reference for local governments, enterprises and investors—supporting high-quality county/district development and advancing China’s low-altitude economy to a new stage.
II. Indicator System
The Low-Altitude Economy Industrial Development Index reflects the overall direction and degree of industry development. Its sub-indices cover five dimensions: industrial development environment, low-altitude aircraft manufacturing, low-altitude infrastructure, low-altitude operations and services, and low-altitude flight service support.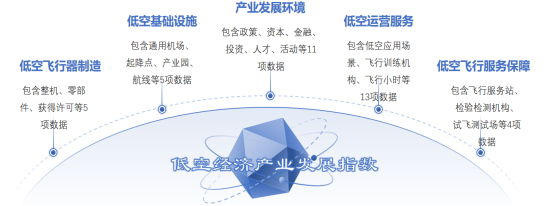
Photo: (1) Principles for Indicator Selection
Indicators for compiling the Low-Altitude Economy Industrial Development Index follow these basic principles.
Scientific principle. Indicators should be grounded in scientific theory, clearly defined, and able to reflect industry characteristics and mechanisms.
Applicability principle. The system should comprehensively and systematically reflect industry conditions and support policy-making and industrial restructuring, while remaining concise and practical for specific evaluations.
Quantifiability principle. Indicators should be measurable to ensure the index is scientific and intuitive.
Operability principle. Data must come from reliable, formal sources; the system should be credible, understandable and widely accepted.
County samples are drawn from China’s top 70 counties by 2024 GDP; district samples cover districts under first-tier and new first-tier cities—including Beijing, Shanghai, Guangzhou, Shenzhen, Hefei, Nanjing, Chengdu, Suzhou, Hangzhou and Chongqing—more than 150 urban districts in total. Low-altitude industry data for these samples were collected and organized.
Photo: (2) Indicator Weights
Weights are determined through comprehensive evaluation of importance, statistical adequacy and cycle consistency, using a ranking-sequence method combined with the Delphi method and refined through time validation. The Delphi workflow is shown in Figure 1:
Chart 1: Delphi Method Workflow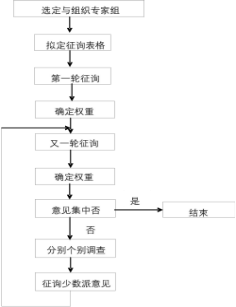
Based on the above principles and methods, and referring to the group standard Rules for Compiling and Publishing the Low-Altitude Industry Development Index, sample weights for each indicator are set as follows.
Chart 2: 2024 County/District Low-Altitude Economy Industrial Development Indicator Weights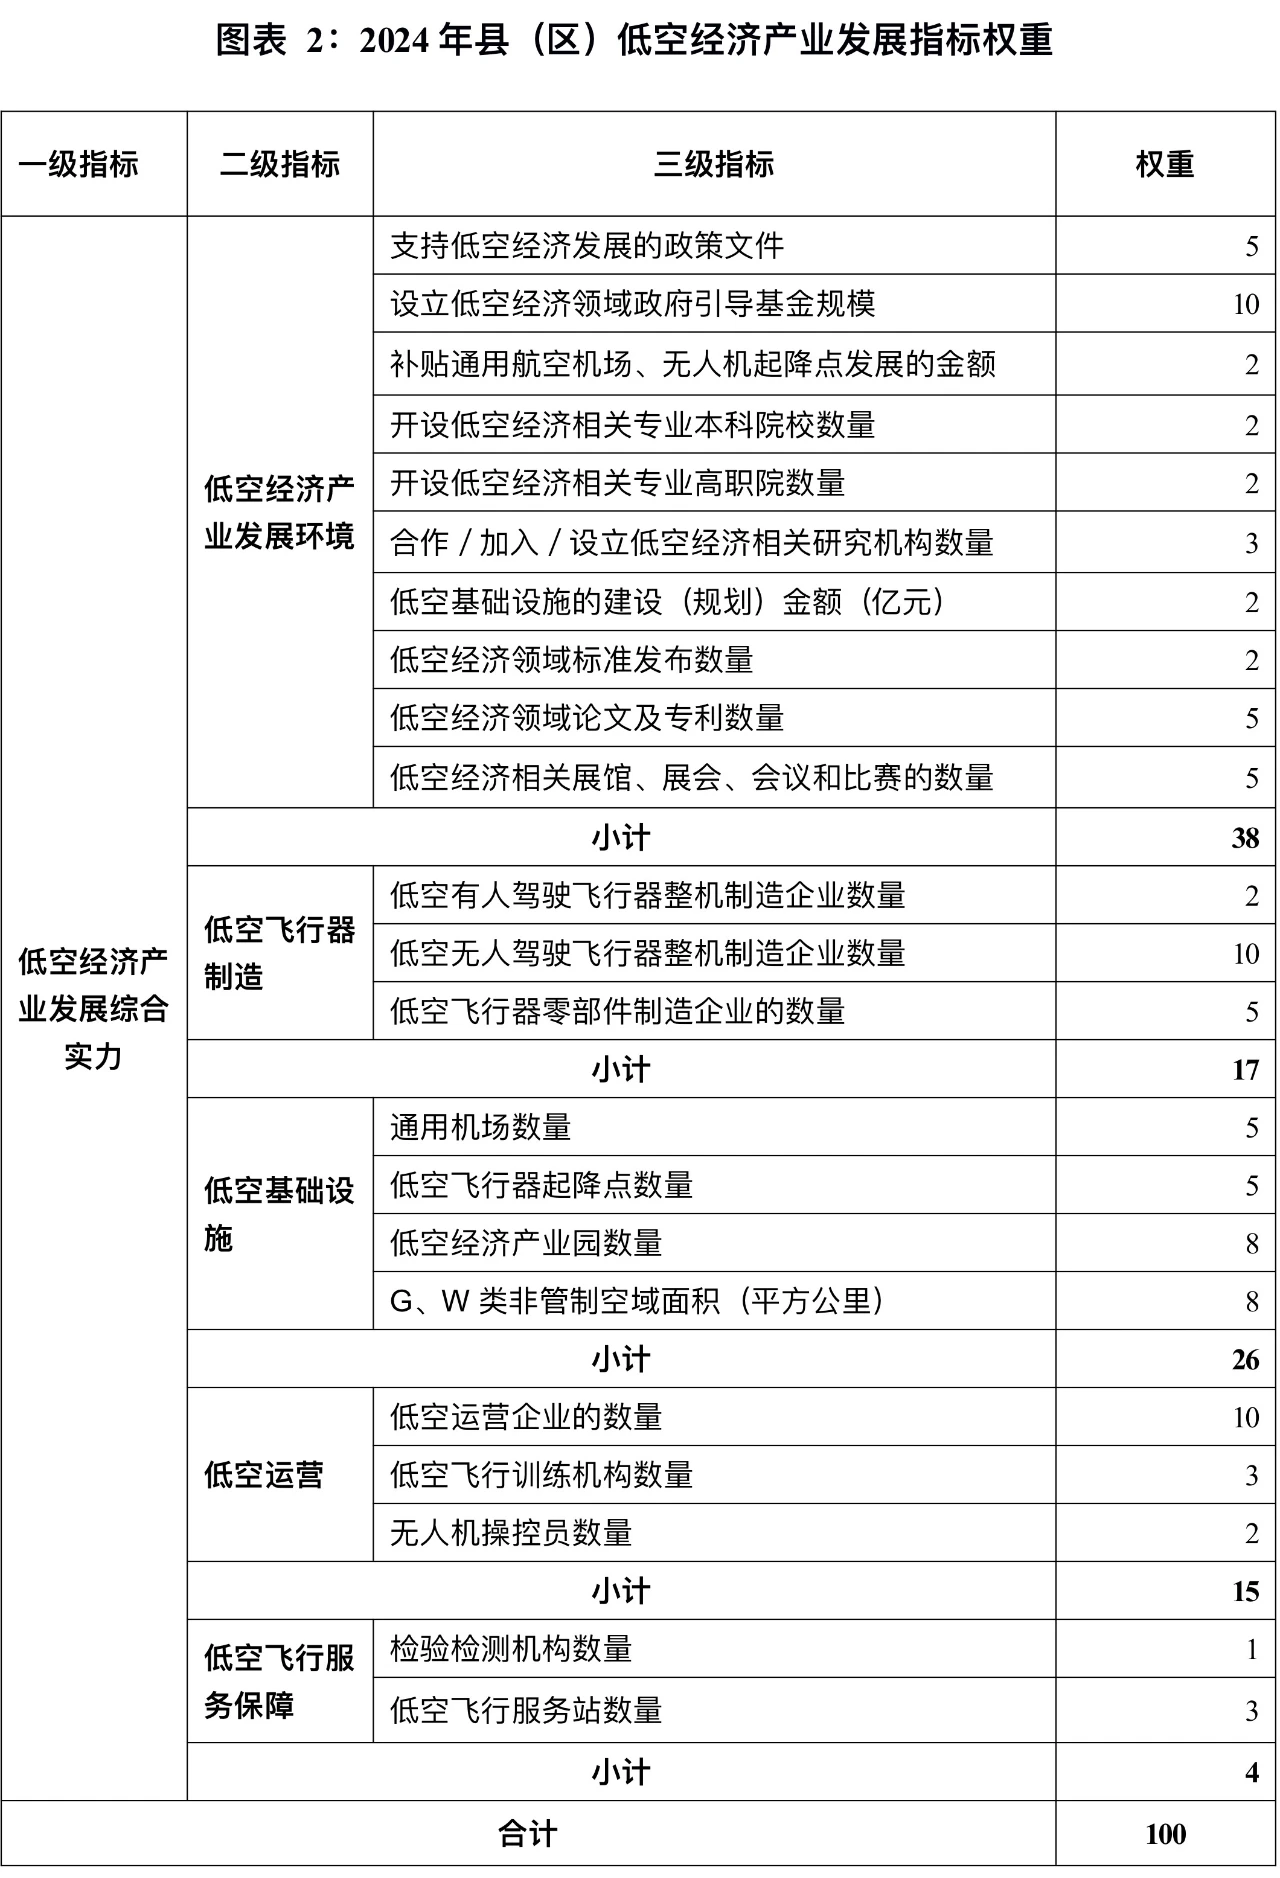
Notes:
1. 2024 is widely seen as the inaugural year of the low-altitude economy. Regions actively issued policies, industrial plans and forums; performance on industrial environment is therefore more visible and assigned a higher weight.
2. Some tertiary indicators—such as the scale of government guidance funds for the low-altitude economy and the number of UAV OEM manufacturers—carry higher weights because they stand out and have clear, direct positive effects on local industry.
3. Some items carry lower weights—such as subsidies for GA airport UAV vertiports and flight service support—because sample counties/districts remain weak in these areas today; they are still included at reduced weights to avoid excessive distortion while recognizing their importance.
4. Data sources for key tertiary indicators include, but are not limited to, local government websites, civil aviation sites, the UOM system and Tianyancha.
Photo: (3) Indicator Calculation Formula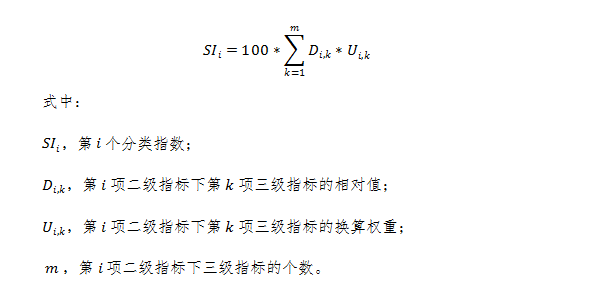
Photo: (4) Overall Indicator Results
1. Analysis of Overall Results
Districts slightly outperform counties on average: Chart 3 shows a mean score of 41.41 for districts versus 35.35 for counties. Districts also score higher on industrial environment, aircraft manufacturing and operations, indicating stronger overall conditions.
Dispersion is greater among counties: variance is 152.52 for counties versus 81.56 for districts. Differences in resources, policy support and industrial bases make county development uneven, while districts are relatively more balanced under more unified urban planning and resource allocation.
Photo: (1) Low-Altitude Industrial Environment
For counties, the max/min/mean are 33.70 / 0.00 / 7.82; for districts, 24.26 / 1.80 / 11.09. County industrial environments differ widely—some lag in policy and supporting facilities—while districts are more balanced and higher overall.
Photo: (2) Low-Altitude Aircraft Manufacturing
Maximum scores are close (15.27 for counties, 14.33 for districts), but the county mean (7.68) trails the district mean (9.89). District manufacturing is more concentrated and mature, with more manufacturers or stronger supply-chain support.
Photo: (3) Low-Altitude Infrastructure
Mean infrastructure scores are close (11.04 for counties, 12.45 for districts). County variance is smaller, suggesting more even infrastructure build-out and relatively ample uncontrolled airspace; districts’ maximum (22.00) exceeds counties’ (20.57), indicating standout performers that raise the average.
Photo: (4) Low-Altitude Operations
Mean operations scores are 8.50 (counties) and 9.34 (districts)—a modest gap. The county minimum (4.34) exceeds the district minimum (1.80), suggesting counties make fuller use of uncontrolled airspace for applications.
Photo: (5) Low-Altitude Flight Service Support
Scores are low for both: means of 0.30 (counties) and 0.32 (districts), with medians of 0.00—clear shortfalls in flight service support across the board.
Chart 3: Distribution of 2024 County/District Low-Altitude Industry Development Indicators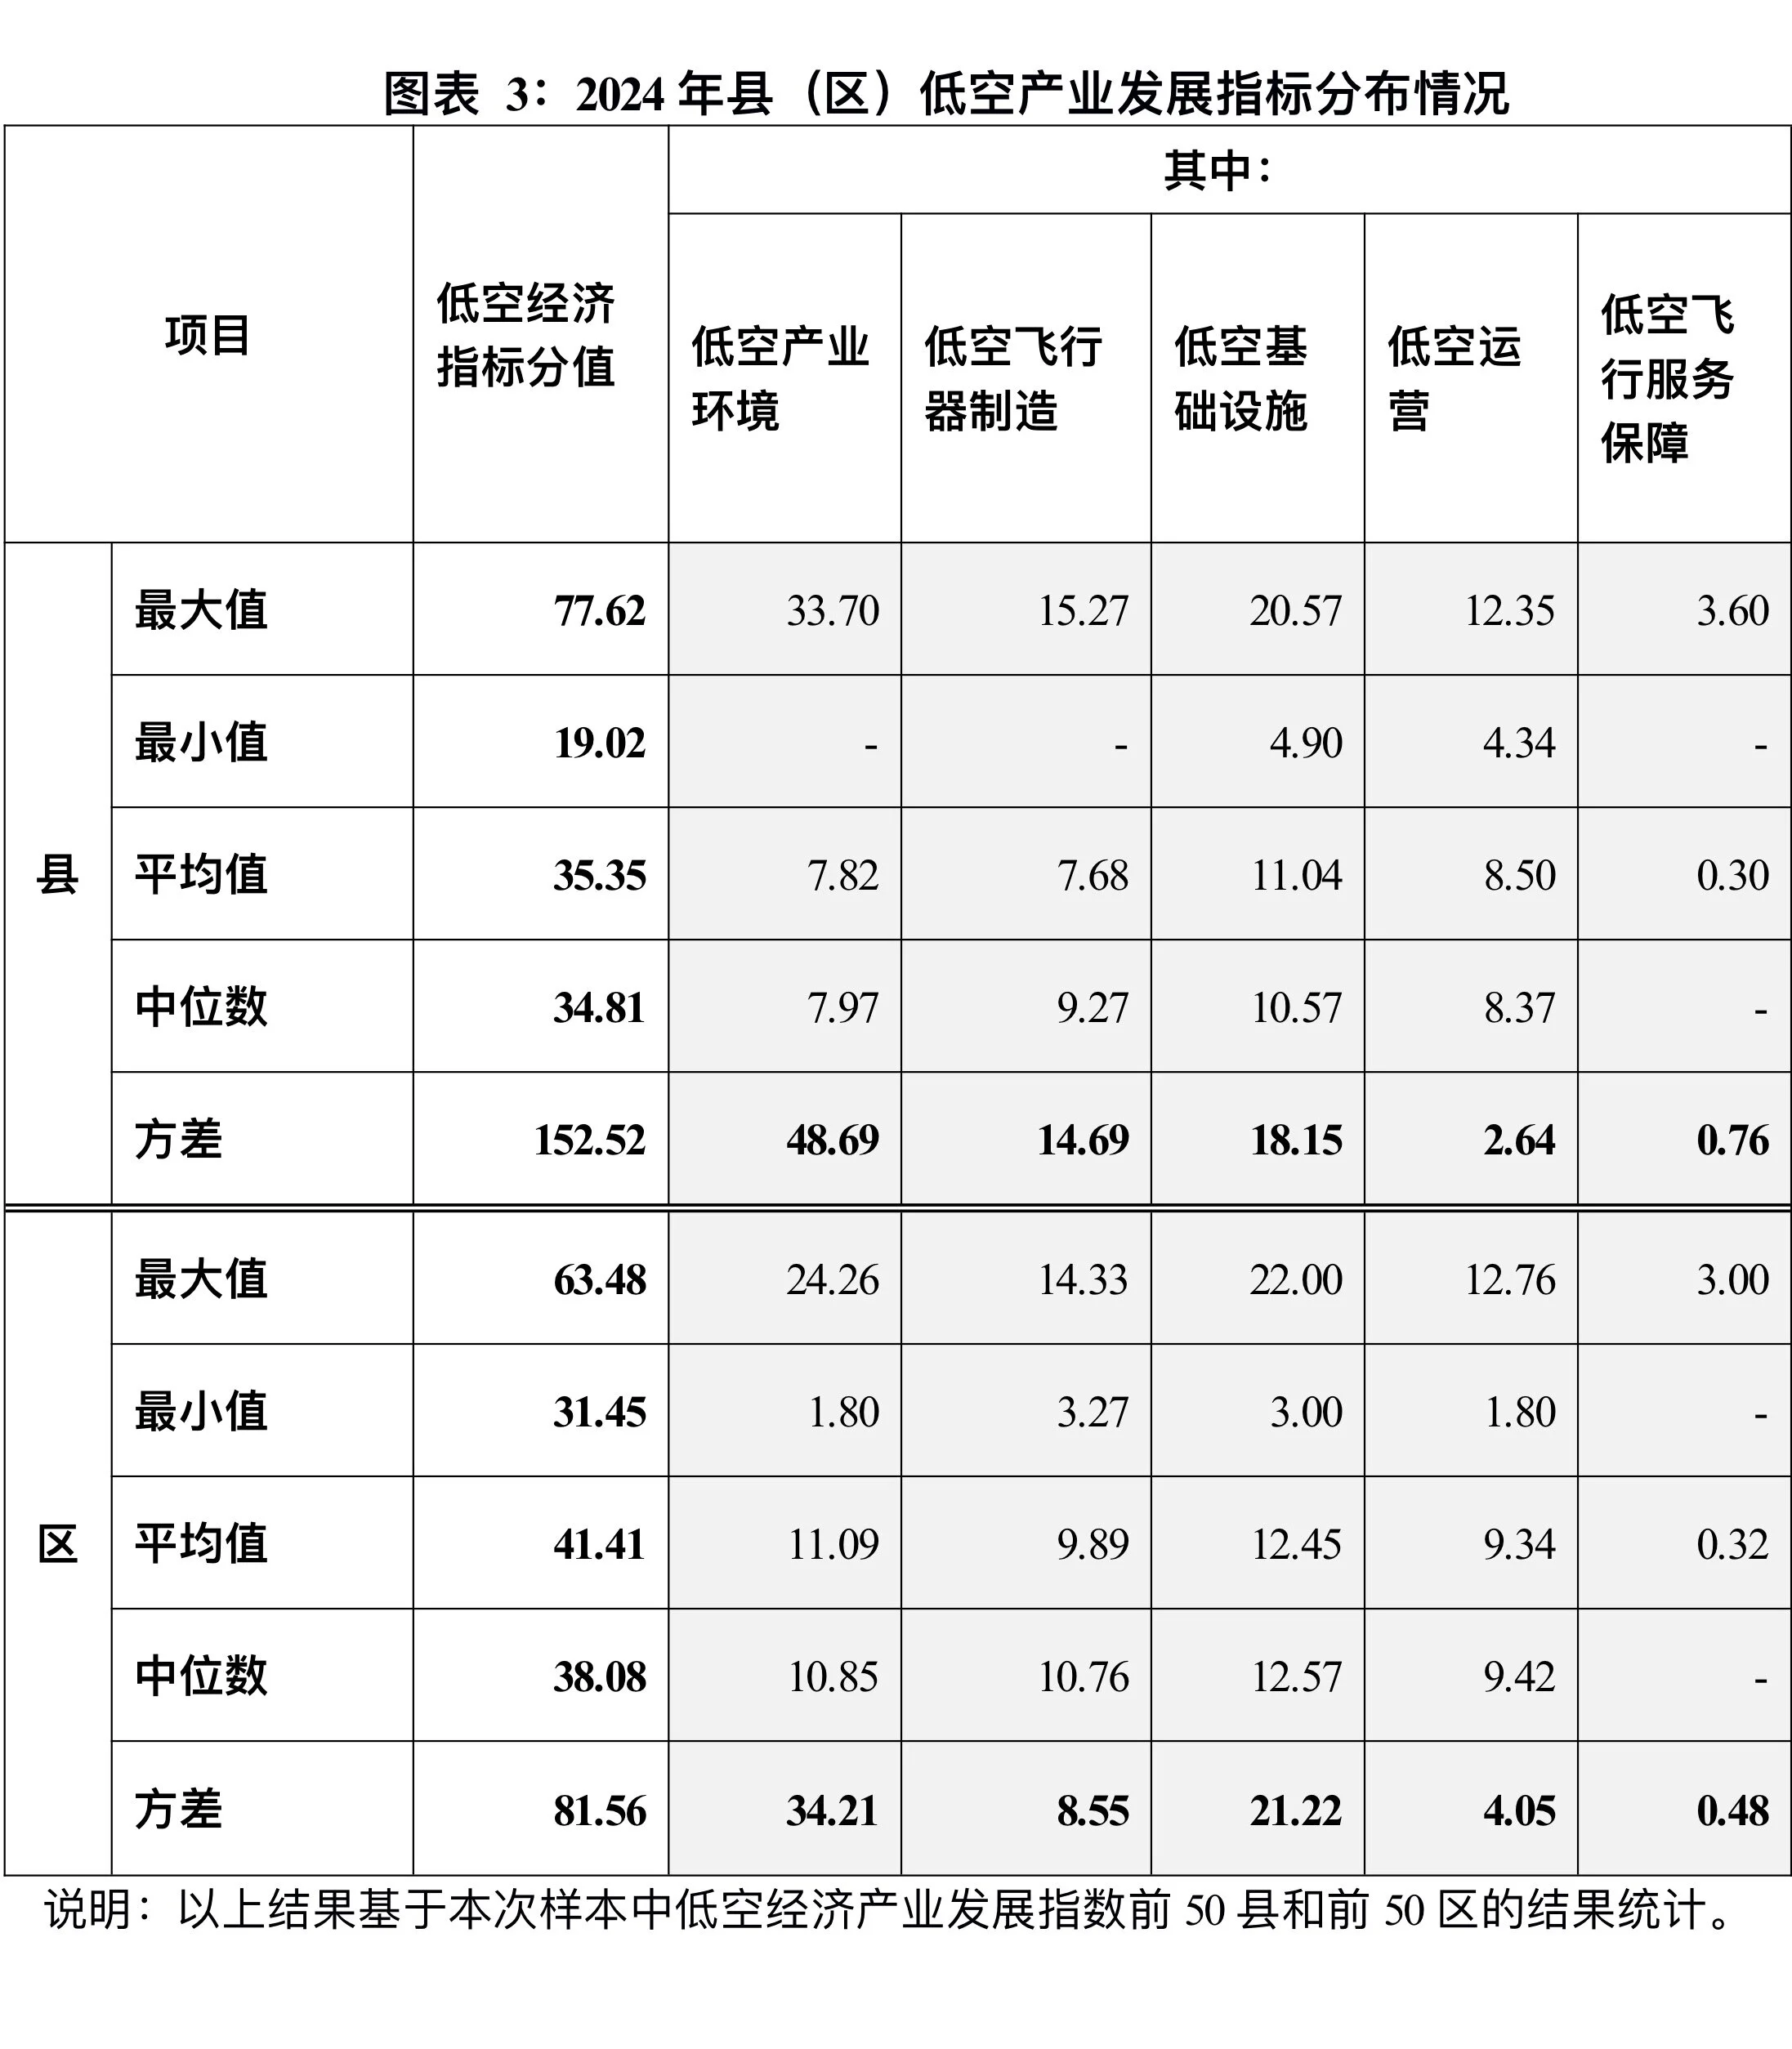
2. County-Level Indicator Analysis
Table 4 presents scores and sub-field data for 50 counties/county-level cities. Jiangsu accounts for many of them, reflecting high participation. Overall scores vary widely—e.g., Changshu, Jiangsu at 77.62 versus Ninghai, Zhejiang at only 19.02.
Photo: (1) Leading Regions
Changshu, Jiangsu: highest total (77.62), strong on industrial environment (33.70) and infrastructure (20.57), relatively balanced across fields—favorable for attracting enterprises and resources.
Kunshan and Dongtai, Jiangsu: also high totals, with manufacturing strengths (Kunshan 12.36; Dongtai 10.20), reflecting solid industrial foundations.
Photo: (2) Sub-Field Highlights
Industrial environment: Changshu (33.70) and Kunshan (24.51), Jiangsu lead—strong policy support and industrial supporting facilities.
Aircraft manufacturing: Longkou, Shandong (15.27) stands out in aviation manufacturing technology and industrial clustering.
Infrastructure: Changshu (20.57) and Liyang (18.26), Jiangsu rank high, with relatively complete GA airports and vertiports.
Photo: (3) Uneven Development
Some regions score low in certain fields, with low-altitude development still nascent or highly unbalanced.
Geographically, eastern coastal regions outperform the central and western regions. Jiangsu, Zhejiang and Shandong post strong figures, while central and western regions lag—pointing to large regional gaps.
Chart 4: 2024 County Low-Altitude Industry Development Index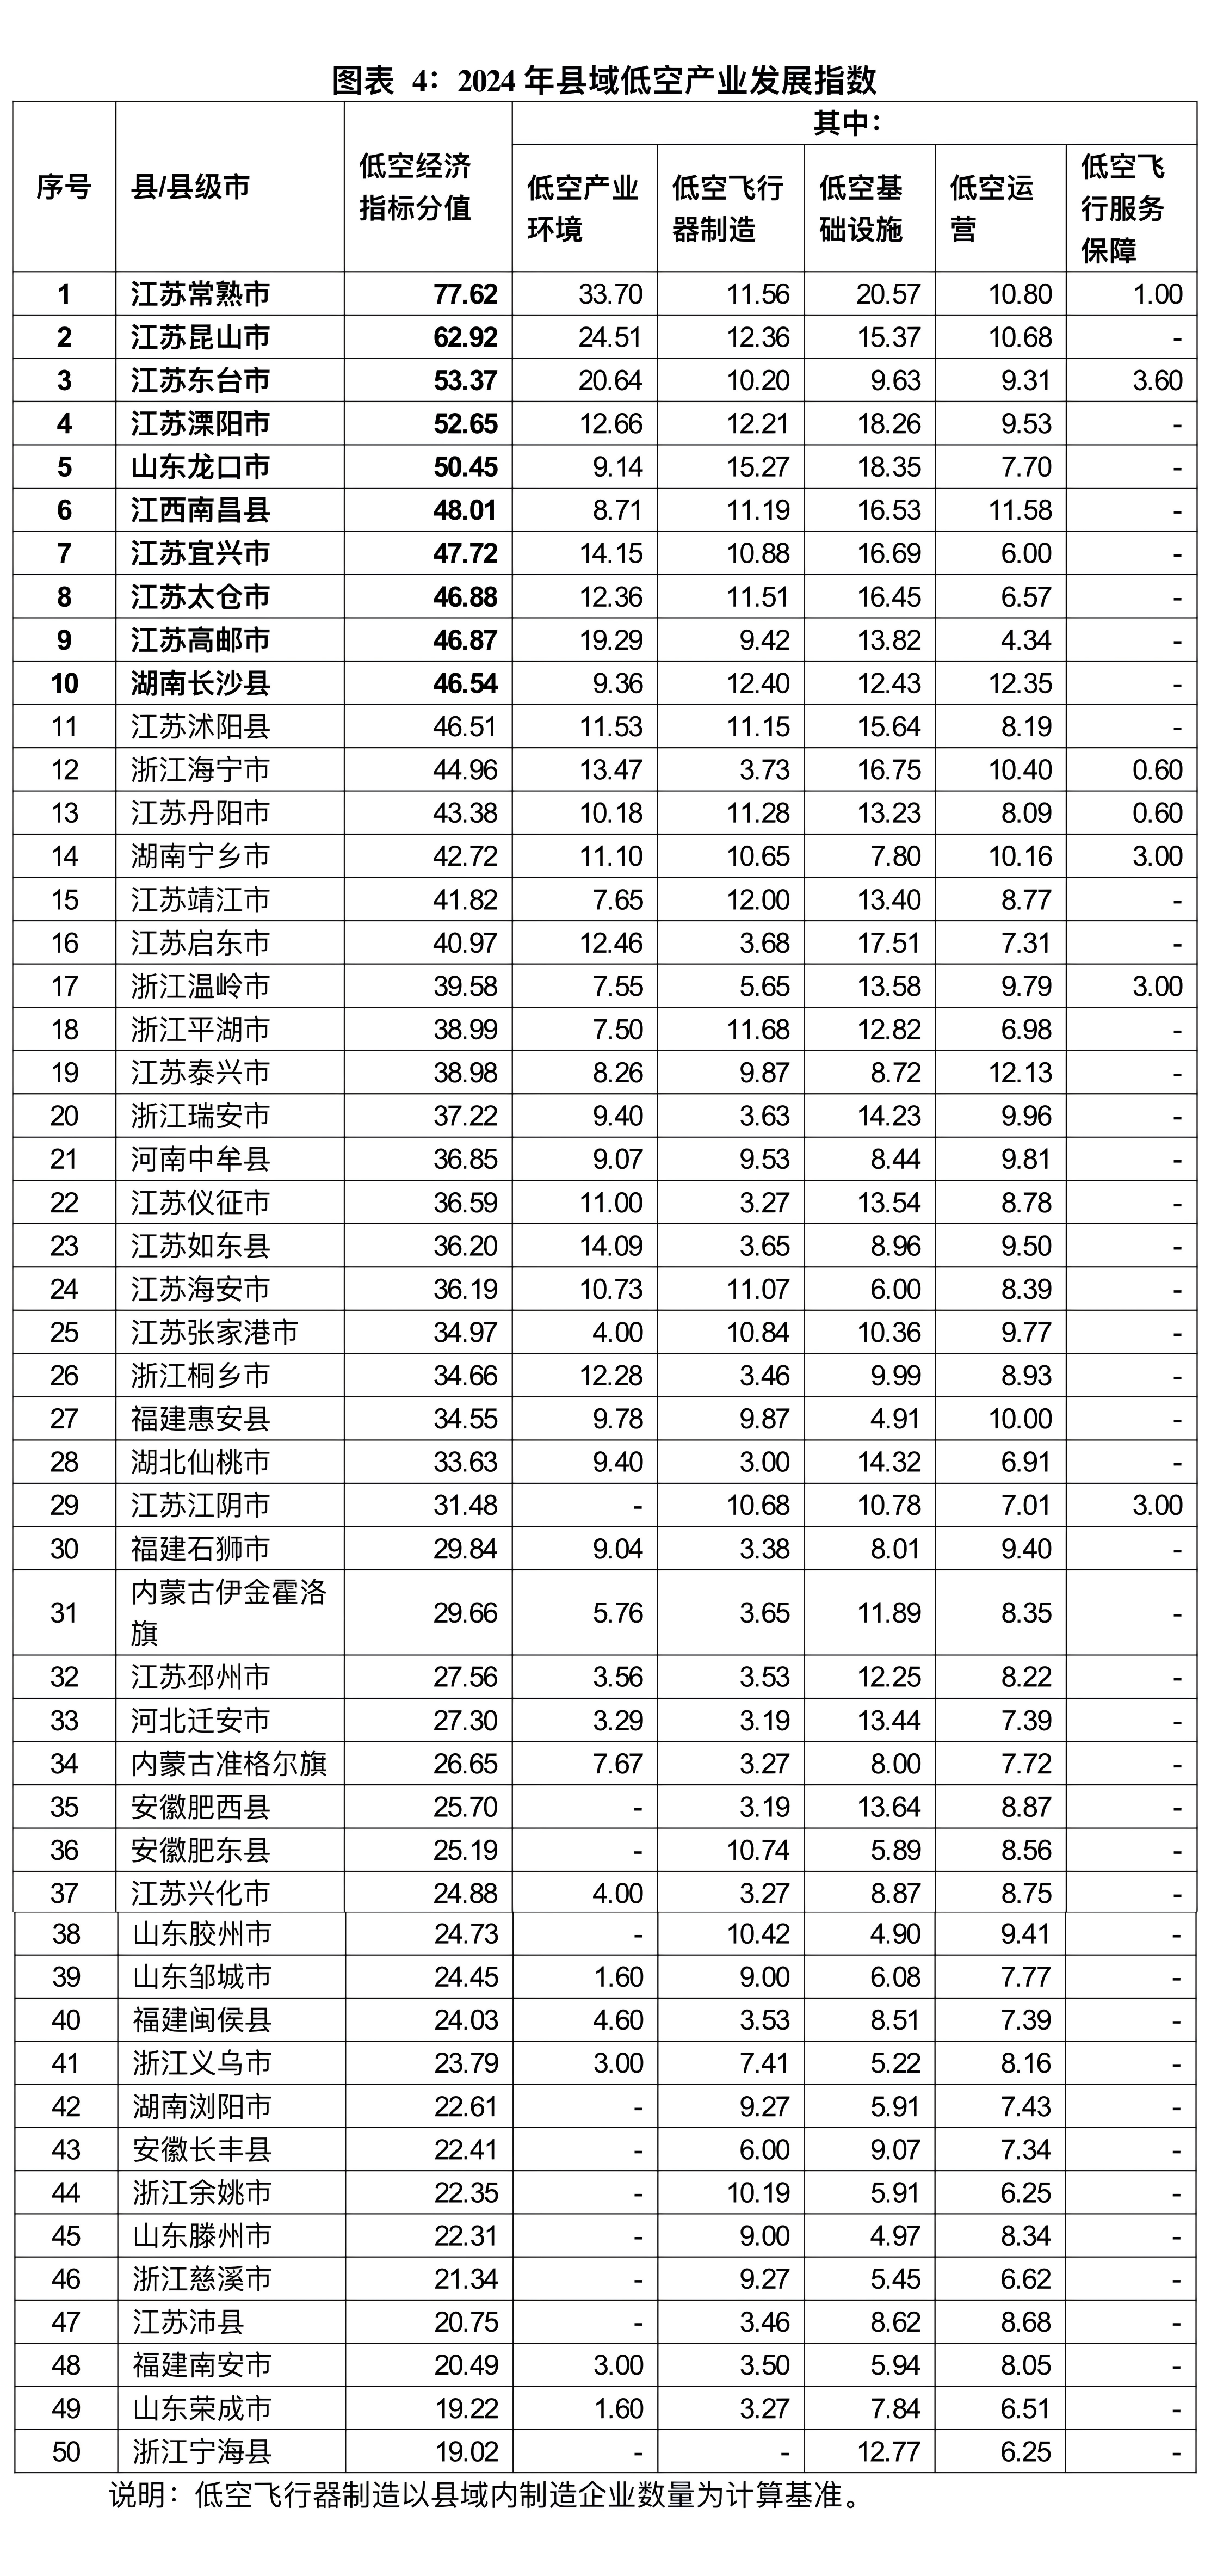
County low-altitude economies are rising overall, but growth speeds diverge sharply; policy guidance is needed to prevent wider gaps. Leading counties should be encouraged to innovate and move up the value chain; lagging counties need tilted support in infrastructure, talent and funding to catch up and develop in concert.
Chart 5: 2024 County Low-Altitude Industry Development Index Trends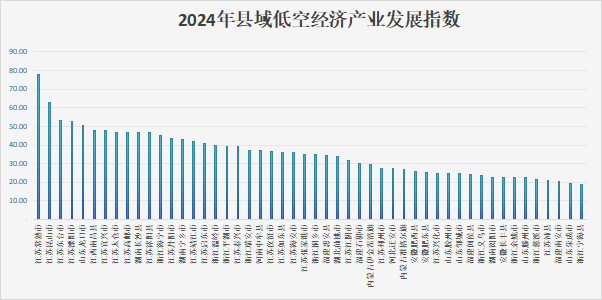
Counties differ in strengths and weaknesses across secondary indicators; development paths vary. Some excel on individual metrics but struggle to perform across all dimensions—reflecting constraints of resources, technology and policy, with balanced development not yet achieved.
Chart 6: Distribution of Secondary Indicators — 2024 County Low-Altitude Industry Index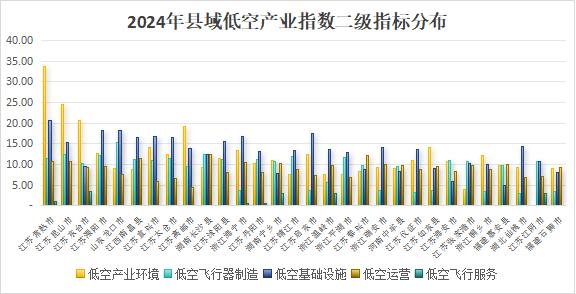
Note: Secondary-indicator distributions show only the top 30 counties.
On industrial environment, Changshu, Kunshan, Dongtai and Gaoyou in Jiangsu perform well, with active layouts in industrial policy, guidance funds and industry forums.
Chart 7: Distribution of 2024 County Low-Altitude Industrial Environment Indicators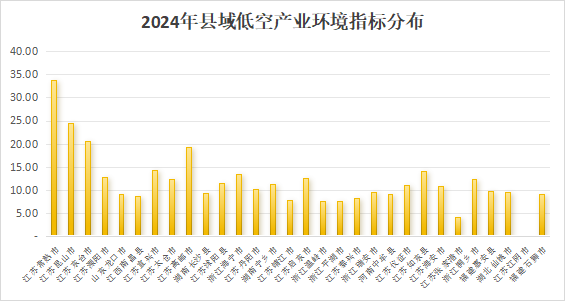
Note: Secondary-indicator distributions show only the top 30 counties, ranked by total score; the same applies below.
On OEM and parts manufacturing, most counties cluster in the 6–12 range, with some standouts and laggards. High scorers can consolidate manufacturing advantages; low scorers need targeted investment (policy support, technology introduction) to lift levels and promote coordinated regional development.
Chart 8: Distribution of 2024 County Low-Altitude Aircraft Manufacturing Indicators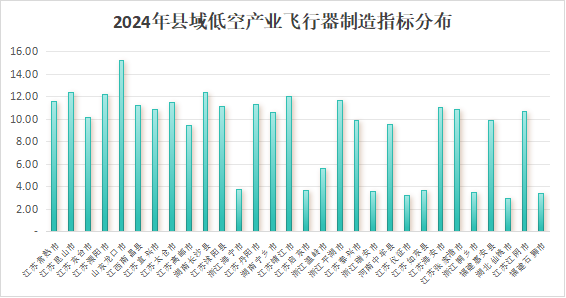
Note: Secondary-indicator distributions show only the top 30 counties.
Infrastructure mainly covers GA airports, vertiports, low-altitude industrial parks and uncontrolled airspace resources—the foundation and guarantee of industry development, critical for long-term growth.
Scores differ markedly across counties; some remain low, revealing infrastructure gaps. Overall development is uneven—some counties have made clear progress; others still need greater investment to support coordinated regional growth.
Chart 9: Distribution of 2024 County Low-Altitude Infrastructure Indicators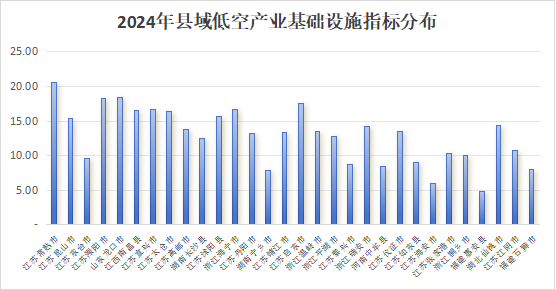
Note: Secondary-indicator distributions show only the top 30 counties.
On operations, relatively mature applications include inspection, surveying/mapping and agriculture; the number of local low-altitude operators is the main measure.
Chart 10: Distribution of 2024 County Low-Altitude Operations Indicators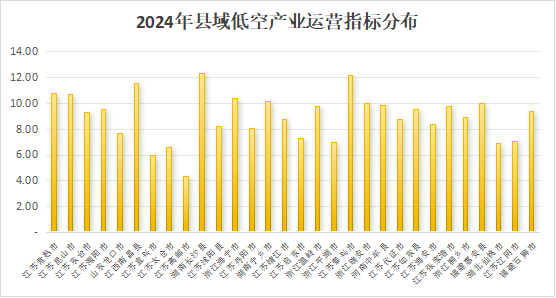
Note: Secondary-indicator distributions show only the top 30 counties.
Scores vary clearly: some counties excel in operations (transport, mission services); others lag. Some have mature, active systems; others still need to optimize models and scale to promote coordinated regional operations.
Flight service support mainly covers flight testing/inspection and flight service stations. As the industry is still early-stage—with applications concentrated in unmanned regional settings and airspace classification/control still unclear—support systems remain incomplete.
Chart 11: Distribution of 2024 County Low-Altitude Flight Service Support Indicators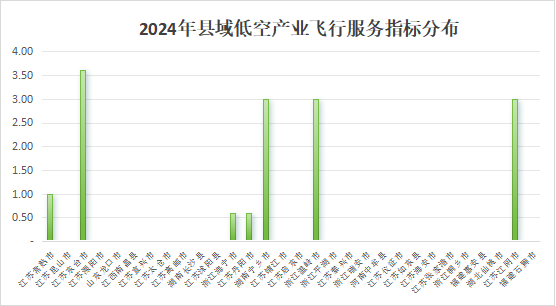
Note: Secondary-indicator distributions show only the top 30 counties.
3. District-Level Indicator Analysis
Table 12 covers 50 districts. Gaps are large: Pukou District, Nanjing tops at 63.48; Qingyang District, Chengdu is lowest at 31.45. Districts in developed cities such as Shenzhen, Nanjing and Shanghai generally rank higher.
Photo: (1) Leading Districts
Pukou District, Nanjing: tops the list at 63.48, strong on industrial environment (24.26) and infrastructure (16.54)—policy and supporting facilities favor development.
Longgang and Nanshan Districts, Shenzhen: scores above 60, strong in manufacturing, infrastructure and operations (Longgang manufacturing 13.29; Nanshan operations 22.00)—reflecting Shenzhen’s strength in aviation manufacturing and services.
Photo: (2) Sub-Field Strengths
Industrial environment: Pukou, Nanjing (24.26) and Yuhang, Hangzhou (21.94) lead—effective policy support and industrial ecosystem building.
Aircraft manufacturing: Bao’an (14.33) and Nanshan (13.92), Shenzhen stand out in aviation manufacturing technology and clustering.
Infrastructure: Nanshan (22.00) and Longgang (20.64), Shenzhen lead, with relatively complete airports and vertiports.
Photo: (3) Development Shortfalls
Some districts score low in certain fields—e.g., Liangjiang New Area, Chongqing and Lishui District, Nanjing—reflecting late starts and weak foundations.
Eastern developed districts generally outperform central and western ones—regional imbalance remains, with substantial room for catch-up inland.
Chart 12: 2024 District Low-Altitude Industry Development Index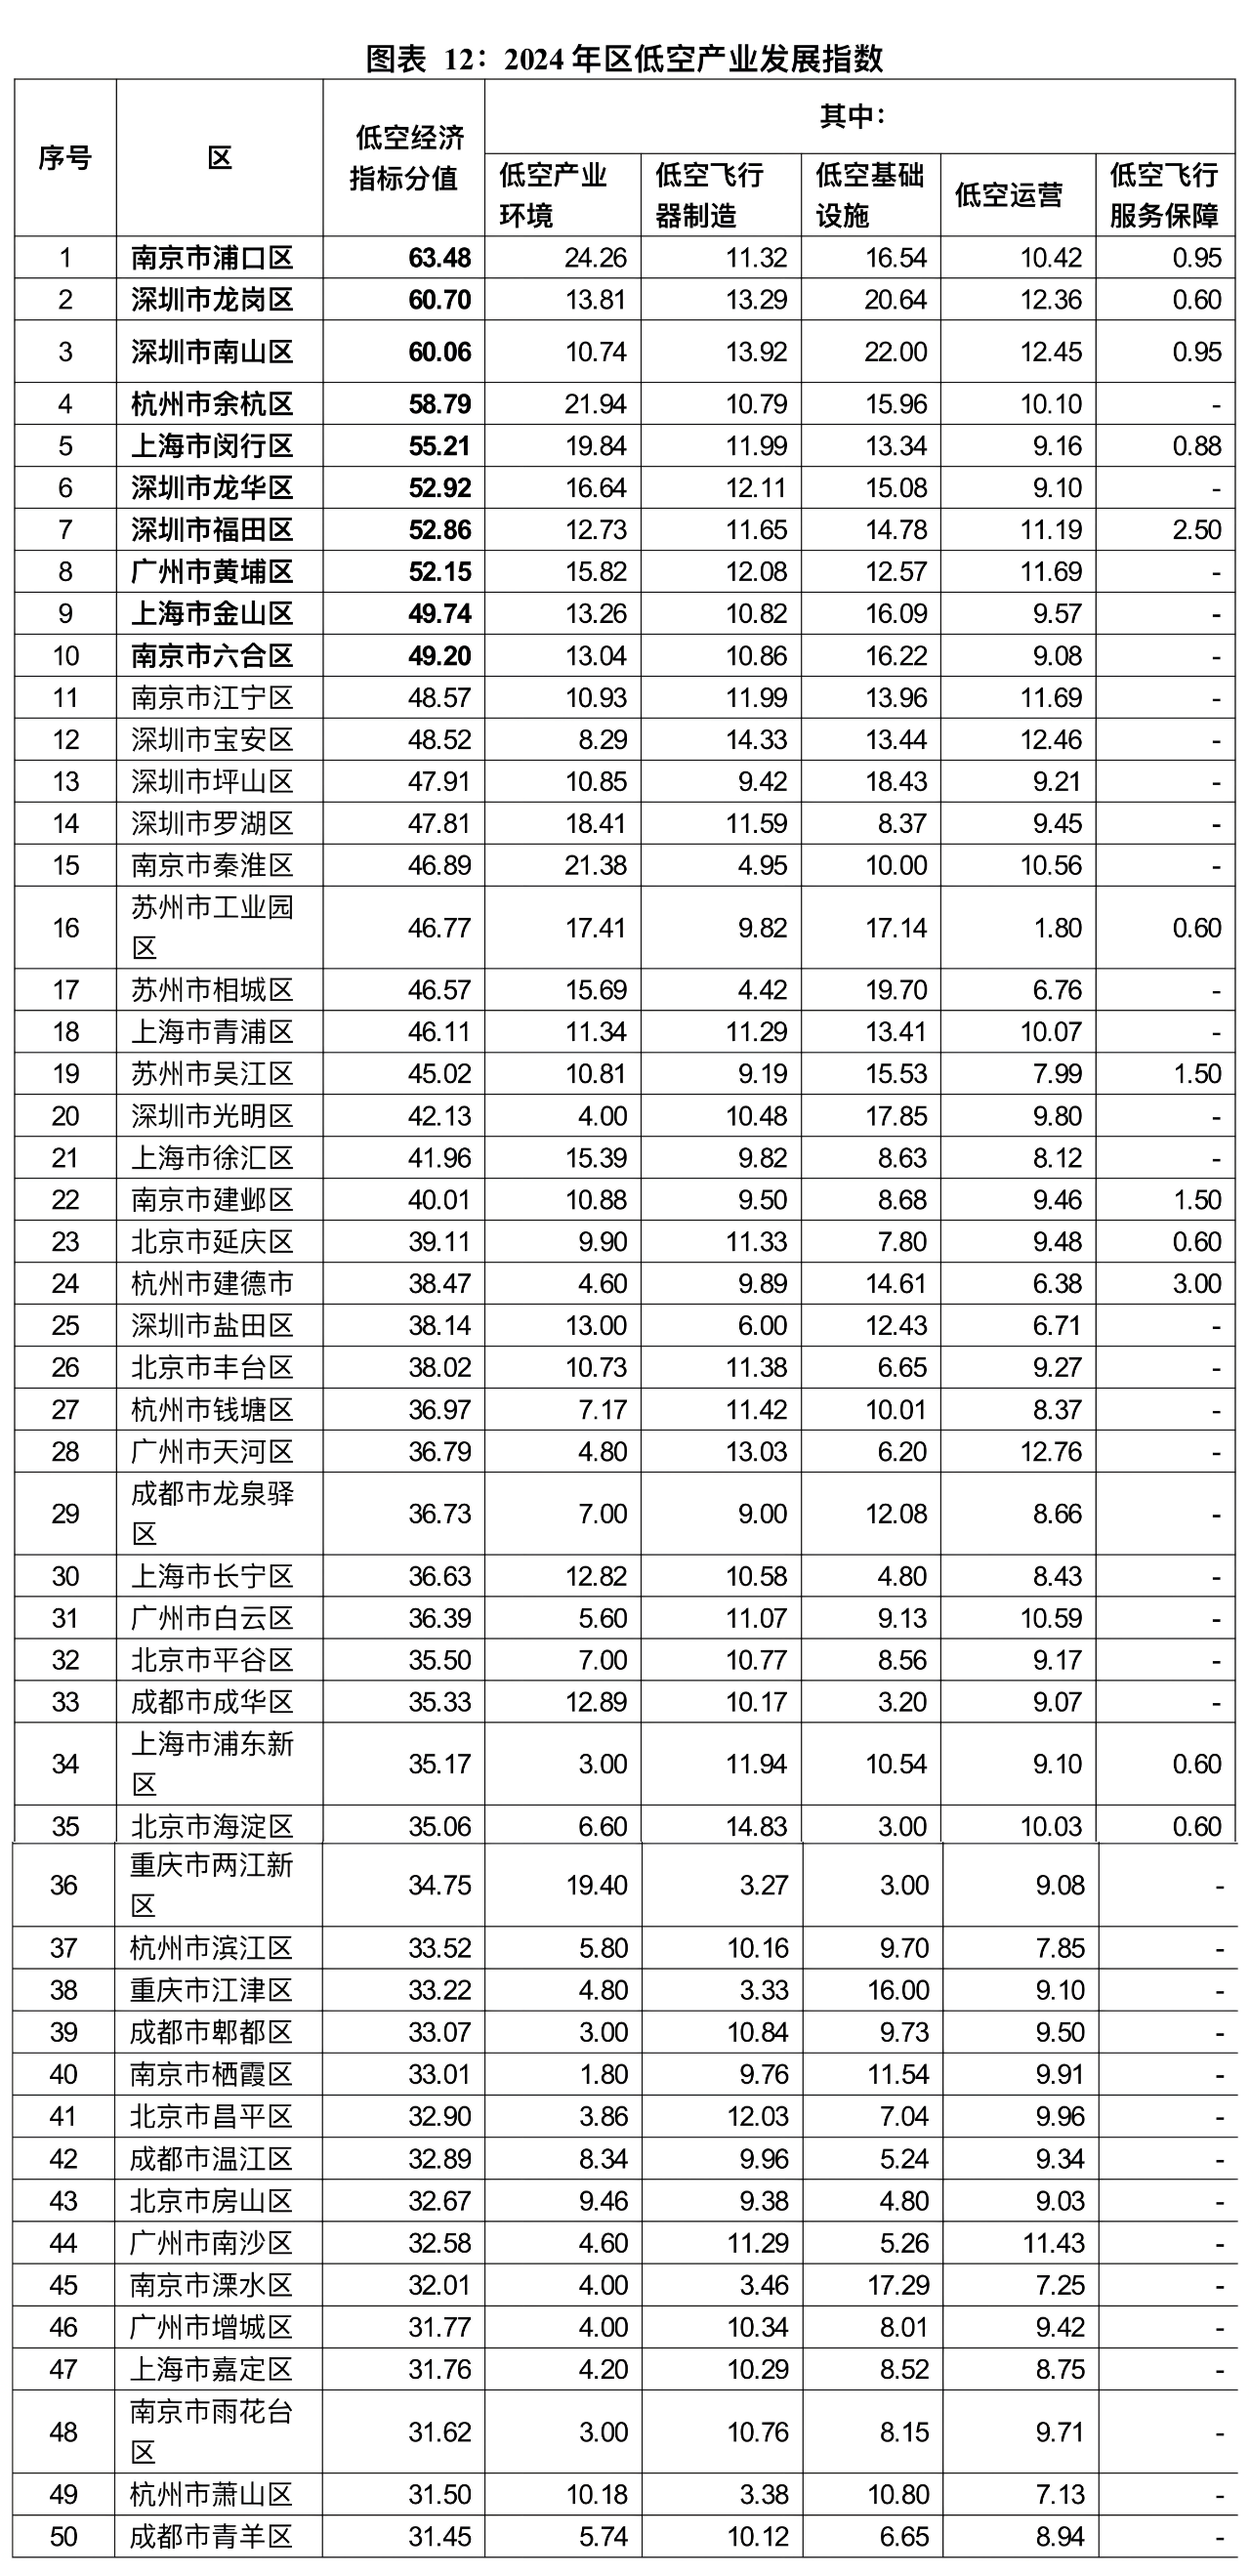
Chart 13: 2024 District Low-Altitude Industry Development Index Trends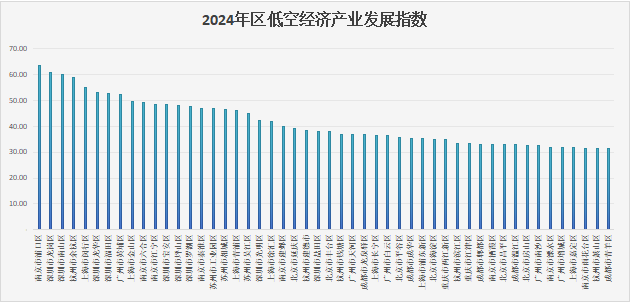
Development across dimensions is uneven—“each with its own focus, strengths and weaknesses.” Pukou (Nanjing), Yuhang (Hangzhou) and Qinhuai (Nanjing) excel on industrial environment; Longgang, Nanshan and Bao’an (Shenzhen) are strong and relatively balanced in manufacturing, infrastructure and operations; flight service support remains sparse and uneven even among top districts.
Chart 14: Distribution of Secondary Indicators — 2024 District Low-Altitude Industry Index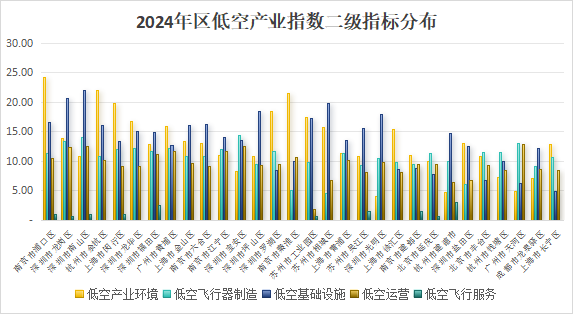
Note: Secondary-indicator distributions show only the top 30 districts.
Industrial environment scores differ widely: Pukou, Nanjing near 25 leads on policy, supporting facilities and business climate; Longgang (Shenzhen) and Yuhang (Hangzhou) also score high, while some districts lag and need improvement through policy support, infrastructure and industrial coordination.
Chart 15: Distribution of 2024 District Low-Altitude Industrial Environment Indicators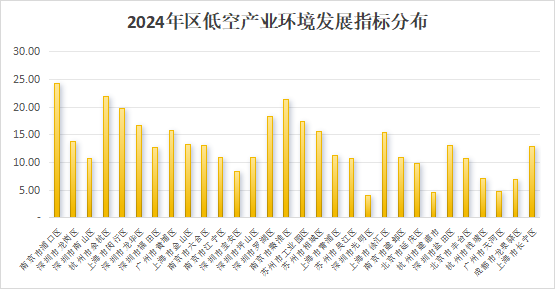
Note: Secondary-indicator distributions show only the top 30 districts, ranked by total score; the same applies below.
Manufacturing scores differ clearly: Bao’an, Shenzhen leads with heavy investment, dense enterprises and strong R&D. Pukou (Nanjing) and Longgang (Shenzhen) also score high; Qinhuai (Nanjing) and Xiangcheng (Suzhou) are weaker. Leaders can consolidate advantages and upgrade; laggards need resource integration, policy support, enterprise attraction and R&D investment.
Chart 16: Distribution of 2024 District Low-Altitude Aircraft Manufacturing Indicators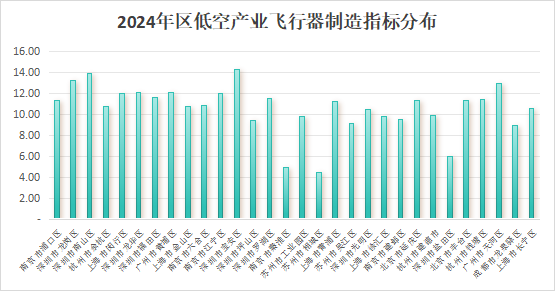
Note: Secondary-indicator distributions show only the top 30 districts.
Infrastructure scores differ widely: Longgang and Nanshan, Shenzhen exceed 20—heavy investment and strong hardware; some districts (e.g., Changning, Shanghai) remain low. Development is uneven; some districts lean on strong infrastructure, others need greater investment.
Chart 17: Distribution of 2024 District Low-Altitude Infrastructure Indicators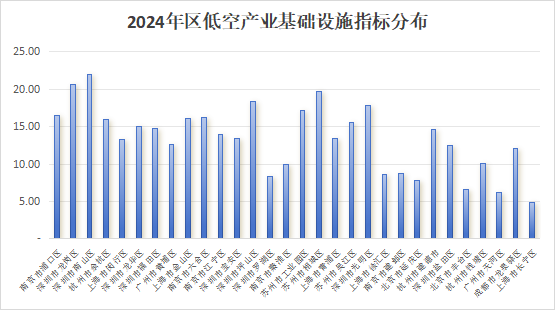
Note: Secondary-indicator distributions show only the top 30 districts.
On operations, Bao’an, Shenzhen nears 12; Pukou (Nanjing) and Longgang (Shenzhen) exceed 10—active businesses and mature systems; some districts still need to strengthen operational capacity.
Chart 18: Distribution of 2024 District Low-Altitude Operations Indicators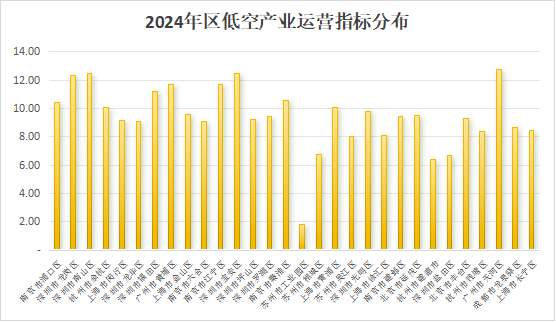
Note: Secondary-indicator distributions show only the top 30 districts.
Flight service support scores differ widely: Jiande, Hangzhou near 3.0 leads with greater investment and a relatively complete service system; Futian, Shenzhen also shows some progress, while most districts remain weak. Leaders benefit from resource integration or policy support; others need more investment in talent and technology to complete the service chain.
Chart 19: Distribution of 2024 District Low-Altitude Flight Service Support Indicators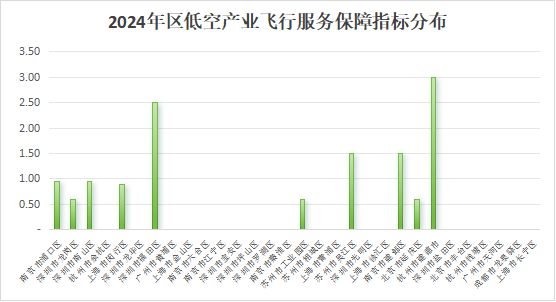
Note: Secondary-indicator distributions show only the top 30 districts.
Photo: (5) Comparative Analysis of County vs. District Sub-Indicators
1. Low-Altitude Industrial Environment
Photo: (1) Top 10 Counties — Industrial Environment
Among the top 10 counties, scores differ on guidance funds and policy documents. Changshu, Kunshan, Dongtai and Gaoyou in Jiangsu stand out on policies, industry funds, infrastructure, and exhibitions/events—reflecting a stronger business environment.
Chart 20: Distribution of Tertiary Indicators — 2024 Top 10 Counties Industrial Environment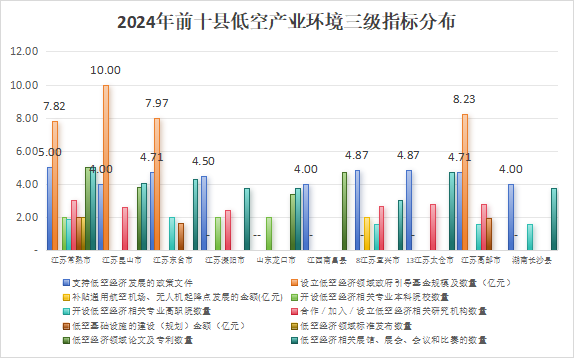
Note: Top 10 counties are selected by total score; the same applies to subsequent charts.
Photo: (2) Top 10 Districts — Industrial Environment
Chart 21: Distribution of Tertiary Indicators — 2024 Top 10 Districts Industrial Environment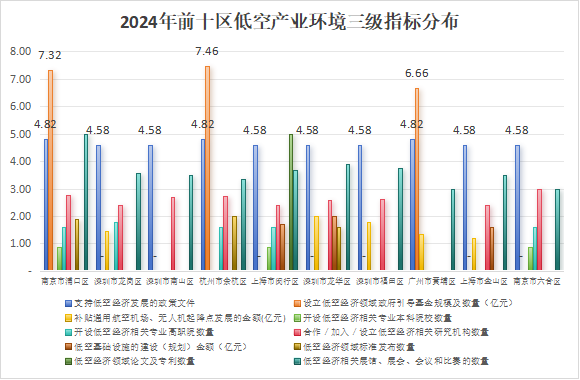
On supporting policy documents, most districts cluster at 4.58–4.82—broad, balanced policy support. On guidance-fund scale, Yuhang (Hangzhou) and Pukou (Nanjing) lead, aiding industrial agglomeration. Infrastructure investment amounts are generally low and need strengthening. Indicators on related colleges, research institutions, standards, papers and patents remain weak. On exhibitions, conferences and competitions, most districts score 3.0–4.0 (e.g., Pukou, Nanjing; Longgang, Shenzhen)—active event organization.
Photo: (3) Top 10 Counties vs. Districts — Industrial Environment Comparison
On supporting policies, counties and districts are broadly similar; leading areas all emphasize policy guidance. On guidance funds, both have layouts, but districts are more even overall. On research and education, both need strengthening—with wider gaps among counties.
2. Low-Altitude Aircraft Manufacturing
Photo: (1) Top 10 Counties — Aircraft Manufacturing
Chart 22: Distribution of Tertiary Indicators — 2024 Top 10 Counties Aircraft Manufacturing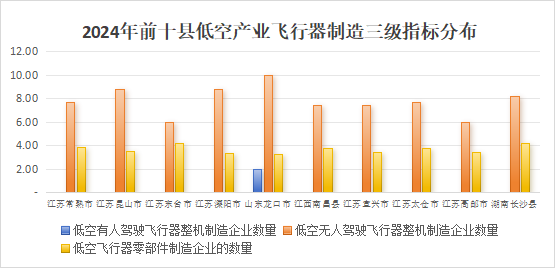
Note: This indicator is based on the number of low-altitude manufacturing enterprises; primary data from Tianyancha.
On UAV OEM manufacturing, the top 10 counties have broad layouts—a key manufacturing focus. The pattern is “UAV OEMs as the mainstay, manned OEMs scarce, parts manufacturing as supporting”—with clear spillover from OEM manufacturing to local industry.
Photo: (2) Top 10 Districts — Aircraft Manufacturing
Chart 23: Distribution of Tertiary Indicators — 2024 Top 10 Districts Aircraft Manufacturing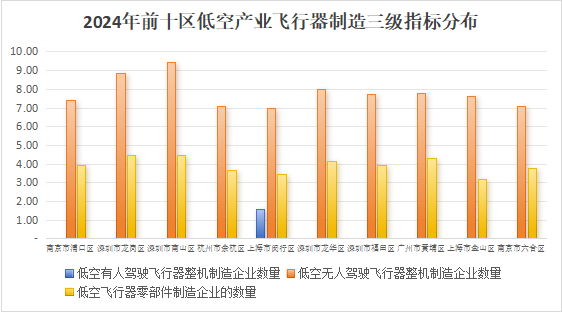
UAV OEM counts are generally high among the top 10 districts—the core manufacturing direction. Parts manufacturers are relatively stable as supporting links. The pattern is UAV-OEM-led; industry structure and supply-chain coordination can be further optimized.
Photo: (3) Top 10 Counties vs. Districts — Manufacturing Comparison
The low-altitude economy is currently dominated by unmanned aircraft; manned OEM manufacturing is weak in both counties and districts. UAV OEM scores for counties cluster at 6–8 (broad but modest), while districts invest more heavily—especially top performers. On parts manufacturing, some counties stand out; district scores cluster at 3–4 (e.g., Pukou, Nanjing; Longgang, Shenzhen)—more even overall.
3. Low-Altitude Infrastructure
Photo: (1) Top 10 Counties — Infrastructure
On GA airports, Dongtai and Liyang, Jiangsu are relatively complete. On vertiports, Changshu (Jiangsu) and Changsha County (Hunan) lead. On industrial parks, Changshu, Kunshan and Taicang, Jiangsu excel in agglomeration. On Class G/W uncontrolled airspace, Gaoyou and Liyang, Jiangsu have stronger airspace resources.
Chart 24: Distribution of Tertiary Indicators — 2024 Top 10 Counties Infrastructure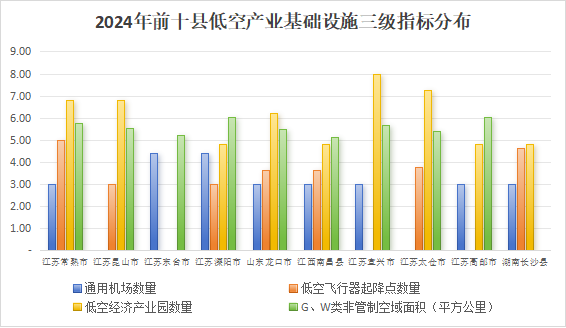
Note: GA airport counts are publicly available, but vertiports are not yet standardized—some actual sites may not appear on authoritative platforms. Industrial parks include integrated parks (e.g., low-altitude industries introduced into existing high-end manufacturing parks). Uncontrolled airspace area is based on the UOM system.
Photo: (2) Top 10 Districts — Infrastructure
Most top districts have some GA airport investment. On vertiports, some place greater emphasis—e.g., Longhua, Shenzhen. On industrial parks, Nanshan leads, followed by Longgang (Shenzhen) and Yuhang (Hangzhou). Class G/W uncontrolled airspace expansion is relatively even.
Among the top 10 districts: industrial parks stand out in some places; GA airports and vertiports vary; airspace area is relatively even. Optimizing layouts and reinforcing weak links will support coordinated infrastructure and stronger overall capacity.
Chart 25: Distribution of Tertiary Indicators — 2024 Top 10 Districts Infrastructure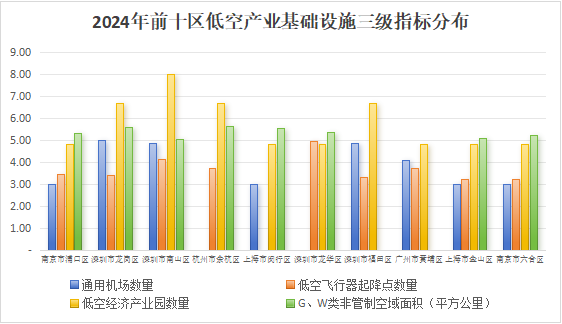
Photo: (3) Top 10 Counties vs. Districts — Infrastructure Comparison
① Number of GA airports
Among the top 10 counties, Kunshan and Dongtai, Jiangsu are relatively strong; among the top 10 districts, Nanshan and Longgang, Shenzhen reach around 4. Overall gaps are modest—both have some layout.
② Number of low-altitude aircraft vertiports
Among the top 10 counties, vertiport counts are generally low; some top districts perform better—districts are more active in vertiport build-out.
③ Number of low-altitude industrial parks
Among the top 10 counties, Changshu and Kunshan, Jiangsu have relatively comprehensive layouts; among districts, Nanshan, Shenzhen leads. Top districts have a slight edge overall—more active agglomeration platforms.
④ Class G/W uncontrolled airspace area
Among the top 10 counties, Liyang, Jiangsu reaches about 6; top districts are generally around 5. Counties have a slight edge in uncontrolled airspace expansion.
4. Low-Altitude Operations
Photo: (1) Top 10 Counties — Operations
Chart 26: Distribution of Tertiary Indicators — 2024 Top 10 Counties Operations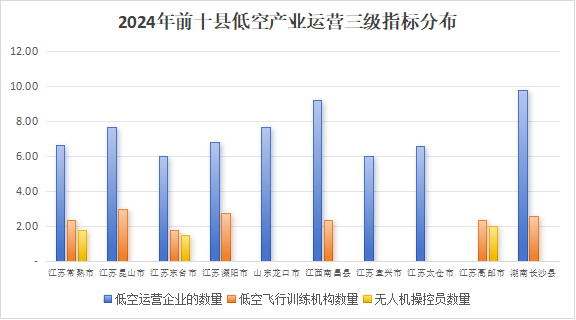
Note: Operator counts are from Tianyancha; flight training institutions and UAV pilots are compiled from public information and may be incomplete. These data are included in the index but at reduced weights to balance reasonableness.
On operators, Nanchang County (Jiangxi) and Changsha County (Hunan) lead—high activity and agglomeration—followed by Longkou, Shandong and others.
On flight training institutions, Kunshan, Jiangsu is relatively strong; overall layouts are sparse with large regional gaps. UAV pilot talent is insufficient and unevenly distributed.
Among the top 10 counties: operator counts differ sharply; training institutions and pilots are insufficient and uneven. Strengthening talent pipelines, optimizing training layouts and balancing operator development will raise overall operations quality and coordination.
Photo: (2) Top 10 Districts — Operations
On operators, Longgang and Nanshan, Shenzhen lead—high activity and agglomeration; Minhang, Shanghai is relatively low—uneven distribution. Flight training institution counts are generally low, with limited layouts and smaller regional gaps.
Chart 27: Distribution of Tertiary Indicators — 2024 Top 10 Districts Operations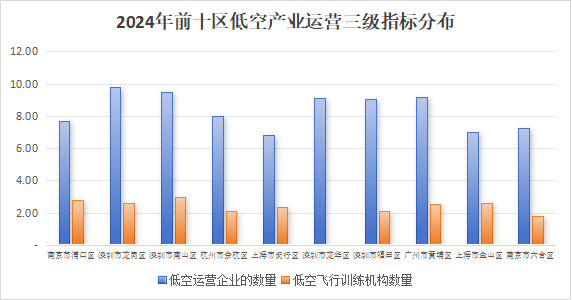
Among the top 10 districts: operator counts differ sharply; training institutions are overall insufficient. Strengthening training capacity and balancing operator development will improve overall operations.
Photo: (3) Top 10 Counties vs. Districts — Operations Comparison
On operators, counties are more even but with limited upside; some districts (e.g., Longgang and Nanshan, Shenzhen) stand out with higher means—stronger agglomeration. Both counties and districts need more flight training institutions. UAV pilot talent remains insufficient, with large room for growth.
5. Low-Altitude Flight Service Support
Photo: (1) Top 10 Counties — Flight Service Support
Flight service support is a basic safeguard of industry development and a key infrastructure link. Even among the top 10 counties, build-out is limited—testing/inspection institutions and flight service stations are generally weak.
Chart 28: Distribution of Tertiary Indicators — 2024 Top 10 Counties Flight Service Support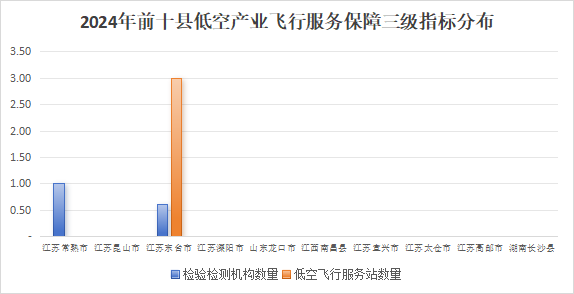
Photo: (2) Top 10 Districts — Flight Service Support
Some districts have a few testing/inspection institutions, but overall counts are low. Only Futian District, Shenzhen shows flight service stations—highlighting its uniqueness and the complete gap elsewhere.
Among the top 10 districts, flight service support is uneven: few testing institutions with limited coverage, and flight service stations only in isolated cases. Greater investment and layout are needed to complete the service system and promote coordinated regional development.
Chart 29: Distribution of Tertiary Indicators — 2024 Top 10 Districts Flight Service Support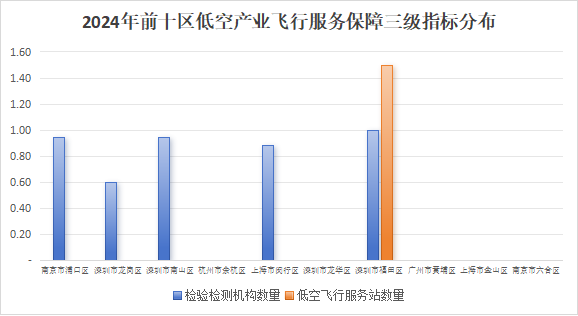
Photo: (3) Top 10 Counties vs. Districts — Flight Service Support Comparison
On testing/inspection institutions, county coverage is narrow and scores are low; districts cover more ground and are more even. Flight service station construction is weak for both.
III. Summary
Photo: (1) County vs. District Comparison Summary
1. Development Level
County means are higher overall, but within-county divergence is greater—reflecting uneven economic bases: some breakthrough via policy or resources, most still nascent. Districts perform better on industrial environment and manufacturing, benefiting from urban agglomeration and technology spillovers.
2. Advantage Areas
Counties are relatively even on infrastructure and operations—likely linked to abundant land and easier application rollout (e.g., agricultural inspection). Districts are more competitive on policy support and manufacturing (e.g., Nanshan, Shenzhen), with urban economic strength supporting higher-end value chains.
3. Shared Challenges
Both counties and districts are weak on flight services; missing airspace management mechanisms and technical standards are core constraints. Central/western areas lag far behind the east—differentiated policies (e.g., special subsidies, enclave economies) can narrow the gap.
Photo: (2) Overall Summary
1. Significant Regional Disparities
China’s low-altitude economy shows stark regional disparities. Eastern coastal provinces such as Jiangsu, Zhejiang and Guangdong hold clear advantages at both county and district levels. Jiangsu, with strong location and economic foundations, has actively laid out related industries across many counties/districts, spawning numerous UAV R&D/manufacturing and flight-service firms with clear agglomeration effects. Zhejiang, leveraging an active private economy and innovation culture, continues to expand UAV applications—especially film/TV production and surveying/mapping. The Pearl River Delta in Guangdong, backed by strong manufacturing and complete supply chains, has large-scale county/district development. By contrast, central and western regions lag overall: many counties/districts are still nascent, with few enterprises and weak supporting facilities. Bridging this gap requires stronger cross-regional collaboration and absorption of eastern industrial transfer and technology spillovers, alongside greater national policy tilt toward inland development.
2. Core Driving Factors
Policy and capital are critical drivers. High-scoring regions typically enjoy strong government guidance funds that ease early-stage financing for startups and R&D. Sound industrial plans clarify regional directions and avoid blind development—e.g., detailed five-year plans prioritizing UAV manufacturing or low-altitude tourism. Dedicated policies—from land preferences and tax relief to talent attraction—create a favorable environment, a shared feature of leading regions.
The number of drone and eVTOL manufacturers and the completeness of the supply chain largely determine competitiveness. Dense manufacturers create agglomeration in R&D and product innovation—competing and cooperating to drive iteration. A complete chain—from materials and parts to assembly and after-sales—raises efficiency, lowers costs and improves quality across the industry.
GA airports, low-altitude industrial parks and airspace development are foundations of long-term, stable growth. Airport numbers and layouts directly affect convenience and coverage; parks provide platforms for agglomeration and resource sharing; scientific airspace planning ensures safe, efficient flight and supports diversified applications such as tourism and logistics.
Flight service support has clear weak links. Testing institutions are severely insufficient, making pre-service quality and safety assurance difficult. Flight service stations—critical for weather, navigation and flight-plan approval—also lag far behind, limiting normalized and standardized operations. Central and western counties/districts additionally face short, single-link supply chains.
3. Future Directions
Policy support for central and western regions should be further strengthened—e.g., dedicated funds and substantial subsidies for investors, plus long-term low-cost land to cut operating costs. Distinctive applications should be cultivated around local needs: agricultural plant protection (spraying, pest monitoring) in farm/forestry-rich areas, and logistics in remote regions to ease transport constraints.
Accelerating technical standardization is essential. On one hand, promote patent filings and greater R&D investment by enterprises and research institutions to strengthen China’s voice in low-altitude technology. On the other, speed up industry standards covering manufacturing, flight safety and service quality for drones and eVTOL—facilitating technology transfer and ensuring interoperability across firms.
A diversified “government-led + market-driven” investment mechanism is a key future direction for infrastructure. Governments should set plans and policies that guide social capital, including PPP investment in GA airports and industrial parks. Private participation eases fiscal pressure, introduces advanced management and technology, raises construction and operating efficiency, and lays a solid foundation for booming development.
As a strategic emerging industry, county-level low-altitude development carries both historic opportunities for local economic upgrading and real challenges of regional imbalance, technology barriers and institutional lag. Counties offer abundant land and diverse scenarios (agricultural plant protection, emergency response, short-haul logistics) as broad testbeds. Yet development is “strong in the east, weak in the west”: inland regions face weak infrastructure, unclear airspace management and scarce talent, struggling to escape “low-end lock-in.” Nationwide, testing-institution coverage and flight service stations remain insufficient—systemic shortfalls in support. The systemic reforms above can help shift from coastal “single-point breakthroughs” to nationwide linkage, forming a positive cycle of “R&D—scenario rollout—service upgrading.” This will not only spawn a trillion-yuan growth pole, but also empower agricultural modernization, efficient logistics and smarter emergency systems through “low-altitude +,” providing a key fulcrum for the dual-circulation development pattern and unlocking new momentum for high-quality county economies.
Aircraft Owners and Pilots Association of China (China AOPA)
Zhuhai AOPA Private Equity Fund Management Co., Ltd. (AOPA Capital)
Suzhou Planning & Design Research Institute Co., Ltd.